Sometimes even the most powerful computer is no match for the human mind.
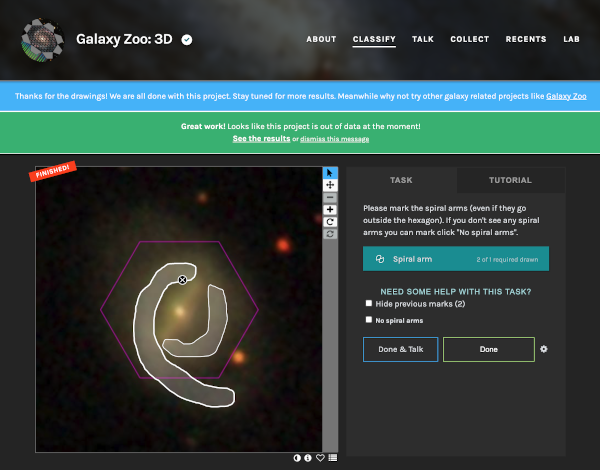
What the Galaxy Zoo: 3D Interface looked like when it was collecting data, in this example showing spiral galaxy MaNGA ID: 1-633990 with example spirals drawn over the image. The purple hexagon indicates the approximate region where MaNGA measured spectra.
Image credit: Zooniverse.org / Sloan Digital Sky Survey
That is what a worldwide team of citizen scientists proved today, in results presented this week at the 237th meeting of the American Astronomical Society. More than 8000 citizen scientists from around the world joined together online to inspect galaxies from the Sloan Digital Sky Survey (SDSS) with Galaxy Zoo 3D, part of the Zooniverse.org citizen science platform.
“Galaxies are beautiful, complex objects, with structures like spiral arms that can vary from thick and solid to wispy and cloud-like,” explains Karen Masters, from Haverford College, Spokesperson for SDSS-IV and the lead author of this work. “If you ignore all this complexity and treat all galaxies as smooth blobs, you’ll miss important truths about how galaxies work.”
This deeper look at galaxies is made possible by the spectra observed with the Mapping Nearby Galaxies at Apache Point Observatory (MaNGA) survey, one of the SDSS’s component surveys.
Spectra are graphs that show the amount of light given off by a galaxy at different wavelengths of light, much like a rainbow shows the amount of sunlight in various colors. Most previous sky surveys have measured only one spectrum for an entire galaxy, but MaNGA works differently.
Rather than measuring only a single spectrum for an entire galaxy, MaNGA uses bundles of 19, 37, 61, 91 or 127 fibers spread right across the galaxy in a hexagonal shape. Thus, the MaNGA survey measures spectra at hundreds of separate points in a single galaxy, resulting in a “data cube” containing full spectroscopic information at each point in the galaxy.
Researchers can then study each data cube to reveal its galaxy’s detailed chemical composition, find the ages and motions of the stars inside it, and map out the ionized gas within, which can in turn be used to estimate how many baby stars are being formed at each position in the galaxy.
The spectra MaNGA measure come from different structures in the galaxies. Images from the SDSS Legacy Survey imaging of all galaxies in the MaNGA target list were the input for Galaxy Zoo: 3D; from there, the volunteers took over. Researchers used the crowdsourcing technique first popularized by the main www.GalaxyZoo.org website — but instead of simply identifying features, volunteers were asked to draw over the image of the galaxy to show where specific features were.
Chris Lintott
“Galaxy Zoo: 3D suggests all sorts of new ways we could collaborate with them.”
Prof. Chris Lintott of Oxford University, the Principal Investigator of the overall Zooniverse project, adds, “I’m continually impressed by the efforts of our citizen scientists, but even more so with the results of this more involved task. It suggests all sorts of new ways we could collaborate with them.”
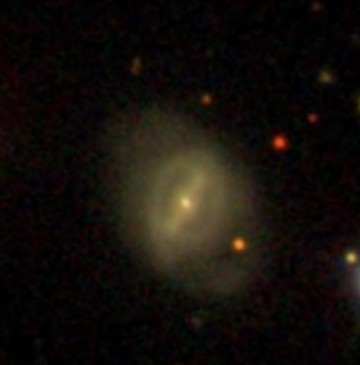
A full collection of around 15 drawings per galaxy, from 15 independent volunteers, were then combined into “heat maps,” which researchers from the team used to identify what visible features match with which spectroscopic features.
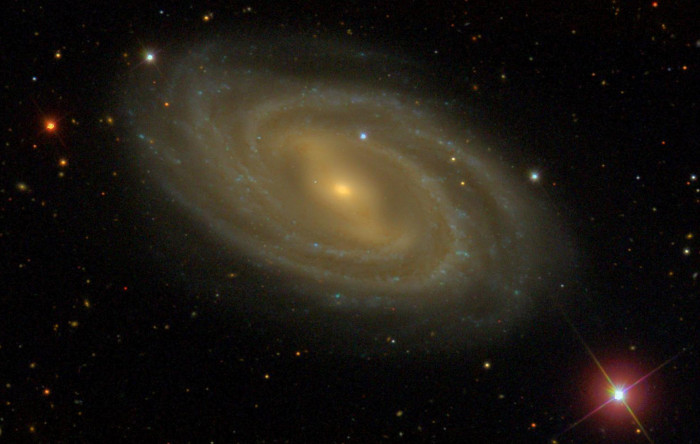
Image credit: Sloan Digital Sky Survey
Galaxy Zoo: 3D’s citizen science technique allows the MaNGA data to be used to trace the impact of a galaxy’s internal structures on, for example, how stars begin to form in a galaxy and how the process of star formation comes to an end. One previously-published result from Galaxy Zoo: 3D was able to show how stars form in a galaxy’s spiral arm, and then fall behind as the arm passes through the galaxy. Another study showed how rings of star formation are common at the ends of galactic bars.
Michael Merrifield, a Professor at the University of Nottingham and a member of the MaNGA team who has made use of the Galaxy Zoo: 3D data said, “Galaxy Zoo 3D has allowed us to do science that has never been possible before, by telling us just where to look for light from the different component parts that make up thousands of galaxies.”
It just goes to show that many eyes are better than a few, and computers won’t be replacing humans for everything any time soon.
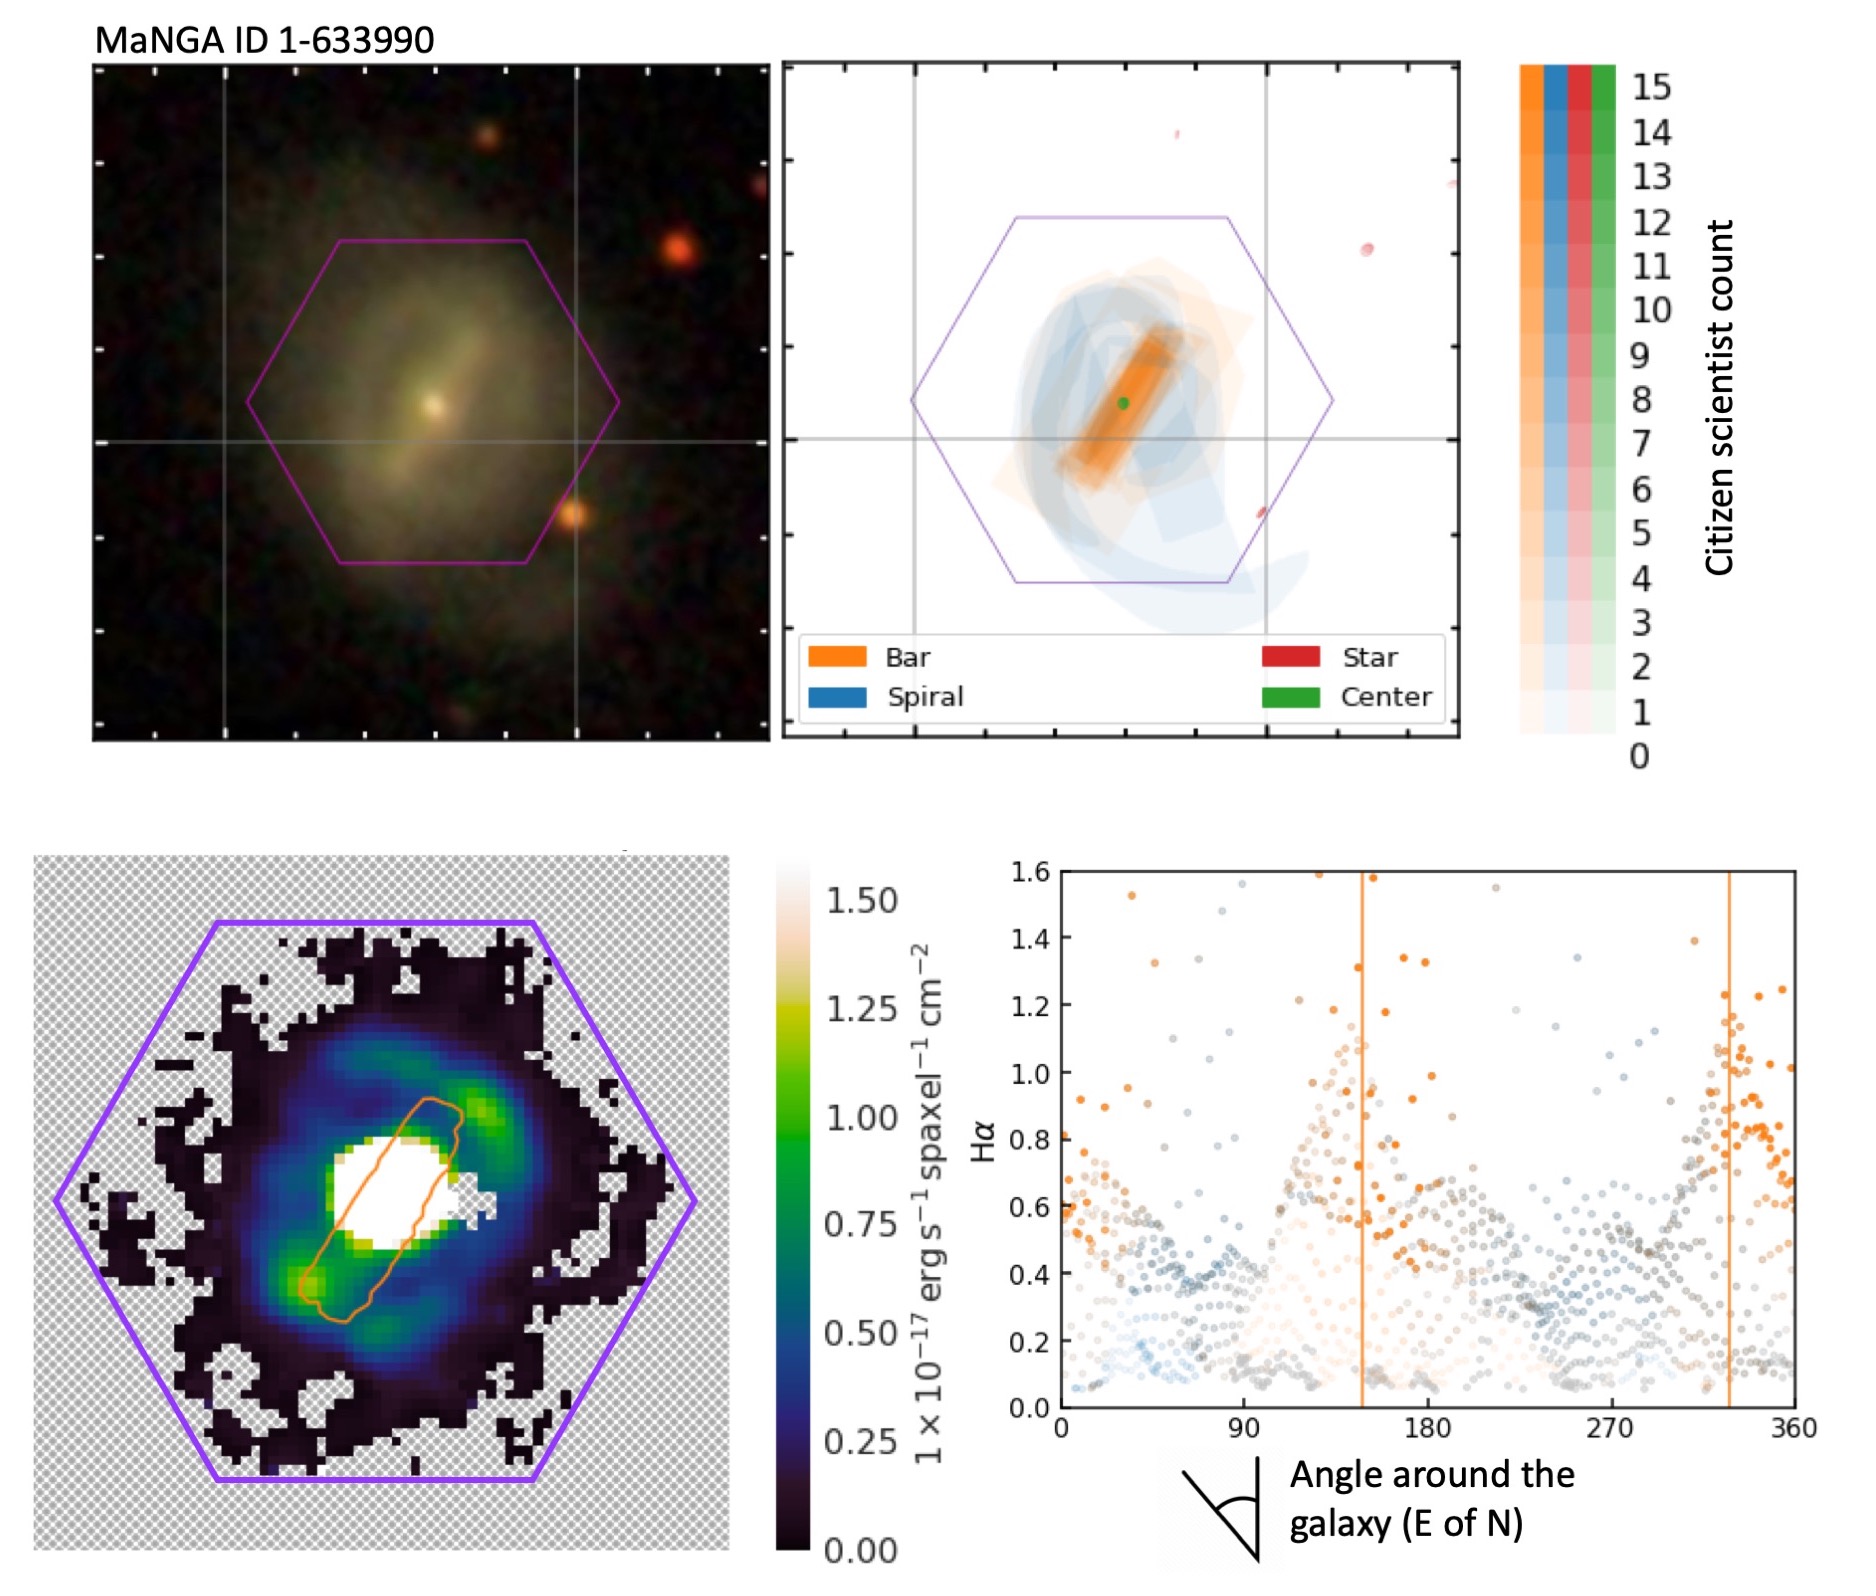
On the lower row, we use the information about where the bar is in MaNGAID 1-633990 to overlay a contour on the map of ionized hydrogen (Ha) emission from MaNGA. This emission is higher where baby stars are forming, and reveals knots of star formation at the ends of the bar.
The final graph shows how the enhancement of the ionized hydrogen emission lines up with the angle of the bar. This galaxy is very far from being uniform at a given distance from its center.
The power of Galaxy Zoo: 3D and MaNGA together means we can now do this kind analysis for 10,000 galaxies, with thousands of different spectral measurements revealing the properties of the stars and ionized gas in the galaxies and for both bars and spiral arms in these galaxies.
Image credit: Karen Masters (Haverford College), Coleman Krawczyk (University of Portsmouth), and the SDSS Collaboration
Images
Image #1
Image #2
Image #3
Image credit: Sloan Digital Sky Survey
Image #4
On the lower row, we use the information about where the bar is in MaNGAID 1-633990 to overlay a contour on the map of ionized hydrogen (Ha) emission from MaNGA. This emission is higher where baby stars are forming, and reveals knots of star formation at the ends of the bar.
The final graph shows how the enhancement of the ionized hydrogen emission lines up with the angle of the bar. This galaxy is very far from being uniform at a given distance from its center.
The power of Galaxy Zoo: 3D and MaNGA together means we can now do this kind analysis for 10,000 galaxies, with thousands of different spectral measurements revealing the properties of the stars and ionized gas in the galaxies and for both bars and spiral arms in these galaxies.
Explore this, and other galaxies yourself with the MaNGA Marvin visualization interface
Image credit: Karen Masters (Haverford College), Coleman Krawczyk (University of Portsmouth), and the SDSS Collaboration
Contacts
- Karen Masters, SDSS Scientific Spokesperson, Haverford College
klmasters@haverford.edu, +1-610-795-6066
Twitter: @KarenLMasters / @SDSSurveys - Michael Merrifield, University of Nottingham
michael.merrifield@nottingham.ac.uk
Twitter: @astromikemerri - Chris Lintott, Principal Investigator, Zooniverse.org
Oxford University
cjl@astro.ox.ac.uk - Jordan Raddick, SDSS Public Information Officer, Johns Hopkins University, raddick@jhu.edu, +1-443-570-7105
Twitter: @raddick
About the Sloan Digital Sky Survey
Funding for the Sloan Digital Sky Survey IV has been provided by the Alfred P. Sloan Foundation, the U.S. Department of Energy Office of Science, and the Participating Institutions. SDSS acknowledges support and resources from the Center for High-Performance Computing at the University of Utah. The SDSS web site is www.sdss.org.
SDSS is managed by the Astrophysical Research Consortium for the Participating Institutions of the SDSS Collaboration including the Brazilian Participation Group, the Carnegie Institution for Science, Carnegie Mellon University, Center for Astrophysics | Harvard & Smithsonian (CfA), the Chilean Participation Group, the French Participation Group, Instituto de Astrofísica de Canarias, The Johns Hopkins University, Kavli Institute for the Physics and Mathematics of the Universe (IPMU) / University of Tokyo, the Korean Participation Group, Lawrence Berkeley National Laboratory, Leibniz Institut für Astrophysik Potsdam (AIP), Max-Planck-Institut für Astronomie (MPIA Heidelberg), Max-Planck-Institut für Astrophysik (MPA Garching), Max-Planck-Institut für Extraterrestrische Physik (MPE), National Astronomical Observatories of China, New Mexico State University, New York University, University of Notre Dame, Observatório Nacional / MCTI, The Ohio State University, Pennsylvania State University, Shanghai Astronomical Observatory, United Kingdom Participation Group, Universidad Nacional Autónoma de México, University of Arizona, University of Colorado Boulder, University of Oxford, University of Portsmouth, University of Utah, University of Virginia, University of Washington, University of Wisconsin, Vanderbilt University, and Yale University.


