For the past five billion years, the expansion of the Universe has been speeding up, powered by the mysterious repulsive force known as “dark energy.” But thanks to a new technique for measuring the three-dimensional structure of the distant Universe, astronomers from the Sloan Digital Sky Survey (SDSS-III) have made the first measurement of the cosmic expansion rate just three billion years after the Big Bang.
“If we think of the Universe as a roller coaster, then today we are rushing downhill, gaining speed as we go,” says Nicolás Busca of the Laboratoire Astroparticule et Cosmologie of the French Centre National de la Recherche Scientifique (CNRS), one of the lead authors of the study. “Our new measurement tells us about the time when the Universe was climbing the hill — still being slowed by gravity.”
Nicolás Busca
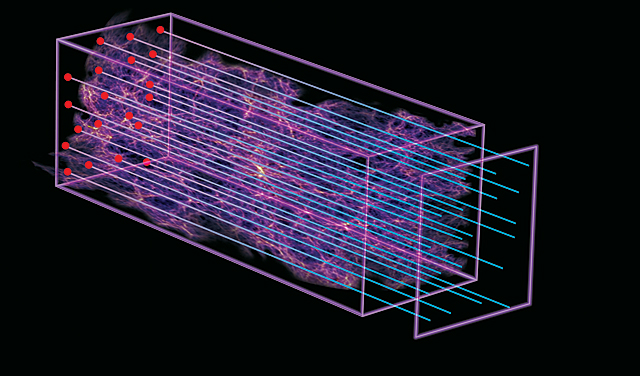
SDSS-III was able to measure the expansion rate of the distant Universe by using quasars to probe the distribution of hydrogen along the line of sight from the each quasar (red dots in the upper left) to the Sloan Foundation 2.5-m Telescope on Earth (abstractly represented as the plane in the lower right).
Light rays from distant quasars (dots at left) are partially absorbed as they pass through clouds of intergalactic hydrogen gas (center). When the light arrives at the spectrograph of the Sloan Foundation 2.5-Meter Telescope (square at right), some has been absorbed, leaving behind a record in the form of a “forest” of small absorption lines in the observed spectrum.
These lines can be interpreted to make a map of the gas along the line of sight between us and the quasar. By examining light from thousands of quasars all over the sky, astronomers can make a detailed three-dimensional map of the distant universe.
In this illustration, the dots at the far left are quasars, and the thin lines show light rays that left those quasars more than 10 billion years ago. Yellow dots are quasars that had been measured by prior projects of the Sloan Digital Sky Survey. By measuring the spectra from ten times as many quasars in this range (red dots), BOSS can reveal the large-scale structure of the early universe in much greater detail.
Illustration Credit: Zosia Rostomian, LBNL; Nic Ross, BOSS Lyman-alpha team, LBNL; Springel et al, Virgo Consortium and the Max Planck Institute for Astrophysics
The results were presented in a paper submitted to the journal Astronomy & Astrophysics; the paper was also posted today on the arXiv.org preprint site. The new measurement is based on data from the Baryon Oscillation Spectroscopic Survey (BOSS), one of the four surveys that make up SDSS-III. It utilizes a technique pioneered by the SDSS in 2005 called “baryon acoustic oscillations (BAO).” The BAO technique uses small variations in matter left over from the early Universe as a “standard ruler” to compare the size of the Universe at various points in its history.
But using that ruler comes with its own difficulties. “If we want to make a measurement at early times, then we need to map structure that is very far away,” says Jim Rich of Centre de Saclay Institute of Research into the Fundamental Laws of the Universe (IRFU), another member of the analysis team. “If we used galaxies, it would be very hard, because galaxies that are far away are also very faint. So we have to try something else.”
The new measurement does not look at galaxies at all. Instead, it makes use of the clustering of intergalactic hydrogen gas in the distant Universe. We can see this gas because it absorbs some light from quasars lying behind. When we measure the spectrum of a quasar, we see not only the light emitted by the quasar, but also what happened to that light in its long journey to Earth. When we look at a quasar’s spectrum, we can see how the intervening gas absorbs some of the quasar’s light. Measuring this absorption — a phenomenon known as the Lyman-alpha Forest — yields a detailed picture of the gas between us and the quasar.
“It’s a cool technique, because we’re essentially measuring the shadows cast by gas along a single line billions of light-years long,” says Anže Slosar of Brookhaven National Laboratory. “The tricky part is combining all those one-dimensional maps into a three-dimensional map. It’s like trying to see a picture that’s been painted on the quills of a porcupine.”
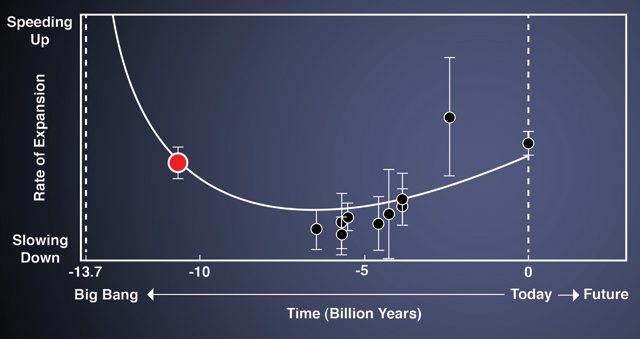
A new measurement from SDSS-III BOSS reaches twice as far into the past as previous direct measurements of the expansion rate (illustrated by the red dot on the left-hand side).
The expansion rate of the Universe was slowing down 10 billion years ago, and started to speed up due to the influence of dark energy 6 billion years ago.
Until recently, three-dimensional maps by BOSS and other surveys were able to measure the regular distribution of galaxies back to only about five and a half billion years ago, a time when the expansion of the Universe was already accelerating.
The numbers along the bottom of the graph show the time in the Universe’s past, in billions of years. The vertical scale (y-axis) shows the expansion rate of the Universe; higher means the Universe was expanding faster. These older measurements appear as data points toward the right of the graph.
The new SDSS-III measurements, shown as the big red point to the far left, have now probed the structure of the early Universe at a time when expansion was still slowing down.
Credit: Zosia Rostomian, LBNL; Nic Ross, BOSS Lyman-alpha team, LBNL
Last year, Slosar and his colleagues used the first 10,000 quasars from SDSS-III’s Baryon Oscillation Spectroscopic Survey (BOSS) to make the first large-scale map of the structure of the faraway “Lyman-alpha forest” gas. As enormous as that map was, it was still not large enough to detect the subtle variations of BAOs. But the new map is big enough — it measures the Lyman-alpha forest using light from 50,000 quasars all over the sky.
When SDSS-III researchers began to study this bigger map more than a year ago, they didn’t know whether or not this technique would work. “When we started, we didn’t want to bias ourselves into seeing what we wanted to see,” says team member Timothee Delubac of Centre de Saclay IRFU. “We only looked at scales where we didn’t expect to see BAOs. But as we moved in on the right scale, we had a very exciting moment. The BAO peak was sitting there in our plot, right where it would be if dark energy were a constant property of space itself.”
Contacts
- Nicolás Busca, Laboratoire Astroparticule et Cosmologie, France, ngbusca -at apc.univ-paris7.fr, +33 1 57 27 60 57
- James Rich, Centre de Saclay Institute of Research into the Fundamental Laws of the Universe (IRFU), james.rich -at- cea.fr
- Anže Slosar, Brookhaven National Laboratory anze -at- bnl.gov
- Kyle Dawson, University of Utah, kdawson -at- astro.utah.edu, +1 801 581 4785
- Michael Wood-Vasey, SDSS-III Spokesperson, University of Pittsburgh, wmwv -at- pitt.edu, 412-624-2751
- Jordan Raddick, SDSS Public Information Officer, raddick -at- jhu.edu, 410-516-8889
The team’s new measurement of the BAO peak, combined with measurements of the same peak at other points in the Universe’s history, paints a picture of how the Universe has evolved over its history. The picture that emerges is consistent with our current understanding of the Universe — that dark energy is a constant part of space throughout the cosmos. What is fascinating about the new result is that, for the first time, we see how dark energy worked at a time before the Universe’s current acceleration started.
“Our goal for BOSS was to measure the expansion of the Universe. We planned to make that measurement in two ways — one a sure thing and one a risky new idea,” says University of Utah astrophysicist Kyle Dawson, the BOSS survey scientist who ensures that good data is taken for each of the 1.8 million galaxies and quasars that BOSS will observe during the 6 years of SDSS-III. “It’s really exciting that, thanks to the dedicated work of so many people, we know that both methods work. We have shown that the Lyman-alpha forest can accurately measure the expansion of the Universe when it was only one-fifth its current age.”
The BOSS measurements show that the expansion of the Universe was slowing down 11 billion years ago due to the mutual gravitational attraction of all of the galaxies in the Universe — but that as the Universe expanded, the constant repulsive force of dark energy began to dominate as matter was diluted by the expansion of space. Thus, more than eighty years after Edwin Hubble and Georges Lemaître first measured the expansion rate of the nearby Universe, the SDSS-III has made the same measurement of the expansion rate of the Universe 11 billion years ago.
David Schlegel
“No technique has ever been able to probe this ancient era before,” says BOSS principal investigator David Schlegel of the Lawrence Berkeley National Laboratory. “Back then, the expansion of the Universe was slowing down; today, it’s speeding up. How dark energy caused the transition from deceleration to acceleration is one of the most challenging questions in cosmology.”
SDSS-III will continue to learn more about dark energy as it collects more than a million and half galaxies and more than 160,000 quasars by the end of the survey. By the time SDSS-III is complete, it will have helped transform the Lyman-alpha forest technique from a risky idea into a standard method by which astronomers explore the nature of the faraway Universe.
Nicolás Busca summarizes: “It looks like the roller coaster crested the hill just about seven billion years ago, and we’re still going.”
Images
SDSS-III was able to measure the expansion rate of the distant Universe by using quasars to probe the distribution of hydrogen along the line of sight from the each quasar (red dots in the upper left) to the Sloan Foundation 2.5-m Telescope on Earth (abstractly represented as the plane in the lower right).
Light rays from distant quasars (dots at left) are partially absorbed as they pass through clouds of intergalactic hydrogen gas (center). When the light arrives at the spectrograph of the Sloan Foundation 2.5-Meter Telescope (square at right), some has been absorbed, leaving behind a record in the form of a “forest” of small absorption lines in the observed spectrum.
These lines can be interpreted to make a map of the gas along the line of sight between us and the quasar. By examining light from thousands of quasars all over the sky, astronomers can make a detailed three-dimensional map of the distant universe.
In this illustration, the dots at the far left are quasars, and the thin lines show light rays that left those quasars more than 10 billion years ago. Yellow dots are quasars that had been measured by prior projects of the Sloan Digital Sky Survey. By measuring the spectra from ten times as many quasars in this range (red dots), BOSS can reveal the large-scale structure of the early universe in much greater detail.
Illustration Credit: Zosia Rostomian, LBNL; Nic Ross, BOSS Lyman-alpha team, LBNL; Springel et al, Virgo Consortium and the Max Planck Institute for Astrophysics
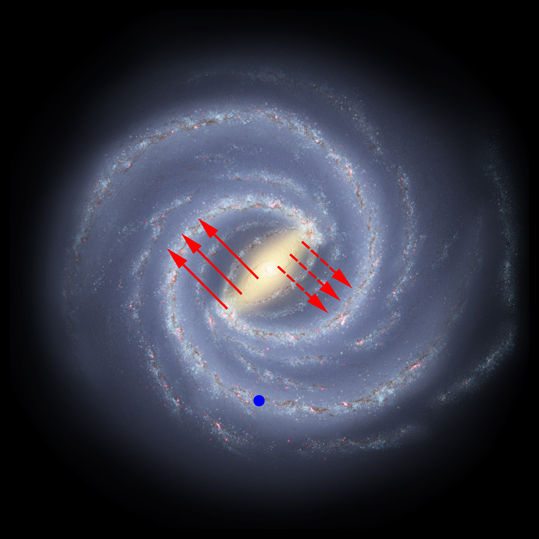
Credit: Jordan Raddick (Johns Hopkins University) and Gail Zasowski (The Ohio State University / University of Virginia). Milky Way artist’s concept by NASA/JPL-Caltech/R. Hurt (SSC-Caltech).
A new measurement from SDSS-III BOSS reaches twice as far into the past as previous direct measurements of the expansion rate (illustrated by the red dot on the left-hand side).
The expansion rate of the Universe was slowing down 10 billion years ago, and started to speed up due to the influence of dark energy 6 billion years ago.
Until recently, three-dimensional maps by BOSS and other surveys were able to measure the regular distribution of galaxies back to only about five and a half billion years ago, a time when the expansion of the Universe was already accelerating.
The numbers along the bottom of the graph show the time in the Universe’s past, in billions of years. The vertical scale (y-axis) shows the expansion rate of the Universe; higher means the Universe was expanding faster. These older measurements appear as data points toward the right of the graph.
The new SDSS-III measurements, shown as the big red point to the far left, have now probed the structure of the early Universe at a time when expansion was still slowing down.
Credit: Zosia Rostomian, LBNL; Nic Ross, BOSS Lyman-alpha team, LBNL
Paper announcing the results
N. G. Busca, T. Delubac, J. Rich, S. Bailey, A. Font-Ribera, D. Kirkby, J.-M. Le Goff, M.M. Pieri, A. Slosar, É. Aubourg, J. E. Bautista, D. Bizyaev, M. Blomqvist, A. S. Bolton, J. Bovy, H. Brewington, A. Borde, J. Brinkmann, B. Carithers, R. A. C. Croft, K. S. Dawson, G. Ebelke, D. J. Eisenstein, J.-C. Hamilton, S. Ho, D. W. Hogg, K. Honscheid, K.-G. Lee, B. Lundgren, E. Malanushenko, V. Malanushenko, D. Margala, C. Maraston, K. Mehta, J. Miralda-Escudé, A. D. Myers, R. C. Nichol, P. Noterdaeme, M. D. Olmstead, D. Oravetz, N. Palanque-Delabrouille, K. Pan, I. Pâris, W. J. Percival, P. Petitjean, N. A. Roe, E. Rollinde, N. P. Ross, G. Rossi, D. J. Schlegel, D. P. Schneider, A. Shelden, E. S. Sheldon, A. Simmons, S. Snedden, J. L. Tinker, M. Viel, B. A. Weaver, D. H. Weinberg, M. White, C. Yèche, D. G. York, G.-B. Zhao, 2012, Baryon Acoustic Oscillations in the Ly-α forest of BOSS quasars, Astronomy & Astrophysics, 552, A96. doi:10.1051/0004-6361/201220724.
About the Sloan Digital Sky Survey
National Science Foundation, and the U.S. Department of Energy Office of Science. The SDSS-III web site is www.sdss3.org .
SDSS-III is managed by the Astrophysical Research Consortium for the Participating Institutions of the SDSS-III Collaboration including the University of Arizona, the Brazilian Participation Group, Brookhaven National Laboratory, University of Cambridge, Carnegie Mellon University, University of Florida, the French Participation Group, the German Participation Group, Harvard University, the Instituto de Astrofisica de Canarias, the Michigan State/Notre Dame/JINA Participation Group, Johns Hopkins University, Lawrence Berkeley National Laboratory, Max Planck Institute for Astrophysics, Max Planck Institute for Extraterrestrial Physics, New Mexico State University, New York University, Ohio State University, Pennsylvania State University, University of Portsmouth, Princeton University, the Spanish Participation Group, University of Tokyo, University of Utah, Vanderbilt University, University of Virginia, University of Washington, and Yale University.


